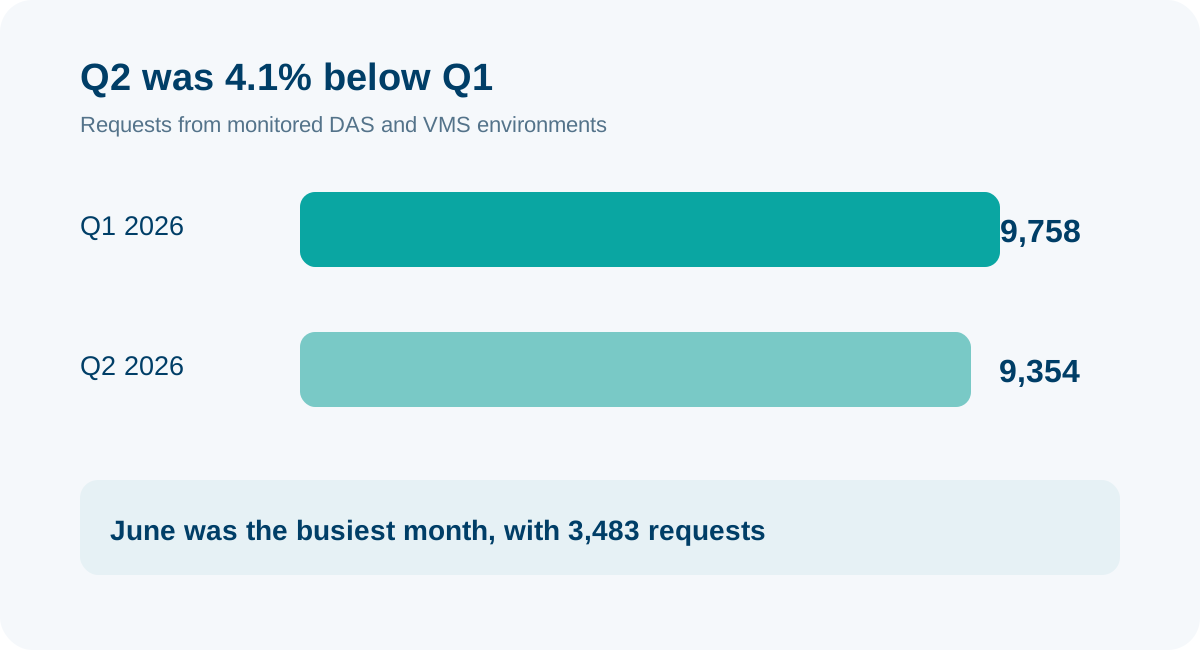
In the second quarter of 2026, NIXZ recorded 9,354 requests from Dutch DAS and VMS environments. This was 4.1 percent below the 9,758 requests in Q1. ICT remained stable at 3,092 requests and accounted for a third of the quarterly volume. The decline was concentrated in other fields, including HR, communications, security and social services.
About the Market Monitor
The NIXZ Market Monitor describes the supplier market for temporary staffing each quarter. It covers formal requests published through dynamic purchasing systems (DAS), vendor management systems (VMS) and supplier environments. Suppliers can submit candidates through these channels.
The analysis excludes requests issued exclusively to contracted suppliers under existing framework agreements. It also excludes private freelance assignments from general freelance platforms and republications through brokers.
Q2 in four figures
- 9,354 requests between 1 April and 30 June 2026;
- -4.1% compared with Q1;
- 3,092 ICT requests, or 33 percent of the total;
- 6.8 days median time between registration by NIXZ and the formal closing date.
Q2 started with 3,149 requests in April and dropped to 2,722 in May. June reached 3,483, the highest monthly volume in the first half of 2026. That recovery did not fully offset the earlier decline: Q2 averaged 135 fewer requests per month than Q1.
ICT remained stable as the total declined
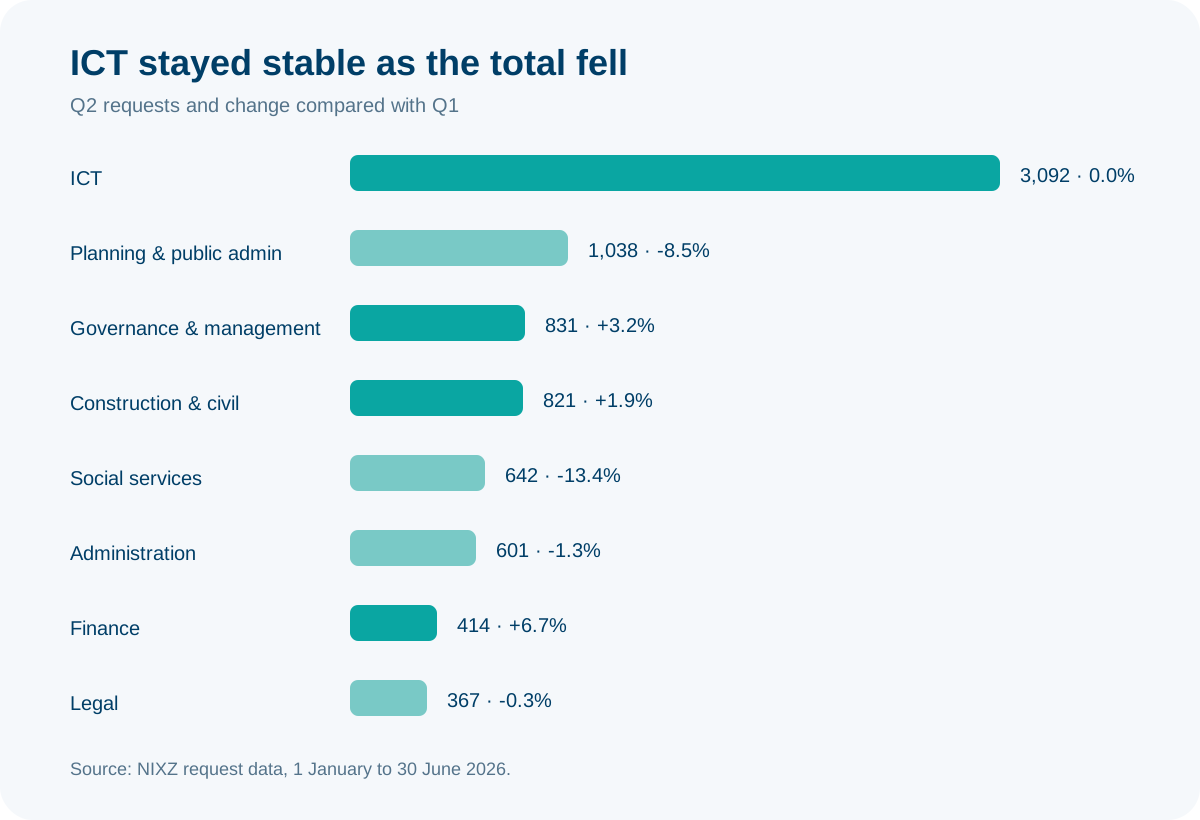
ICT recorded almost exactly the same number of requests in Q2 as in Q1: 3,092 versus 3,091. Its share of total volume therefore rose to 33 percent. Spatial planning and public administration followed with 1,038 requests, governance and management with 831, and construction and civil engineering with 821.
Most active fields in the past three months
| Field | Requests | Share |
|---|---|---|
| ICT | 3,092 | 33.1% |
| Spatial planning and public administration | 1,038 | 11.1% |
| Governance and management | 831 | 8.9% |
| Construction and civil engineering | 821 | 8.8% |
| Social services | 642 | 6.9% |
| Administration | 601 | 6.4% |
| Finance | 414 | 4.4% |
| Legal | 367 | 3.9% |
| Human resources | 334 | 3.6% |
| Healthcare | 317 | 3.4% |
Finance grew by 6.7 percent to 414 requests. Governance and management grew by 3.2 percent and construction and civil engineering by 1.9 percent. HR (-23.2 percent), communications (-25.1 percent), security (-30.8 percent) and education (-31.8 percent) all declined significantly. Social services fell by 13.4 percent but remained one of the larger segments at 642 requests.
For a staffing agency, volume and direction together are more useful than growth alone. Finance grew relatively strongly, but ICT offered more than seven times as many requests. A declining segment such as social services still had more volume than finance. The agency's own candidate portfolio and access to the right sources then determine the actual accessible demand.
Different sources matter in each field
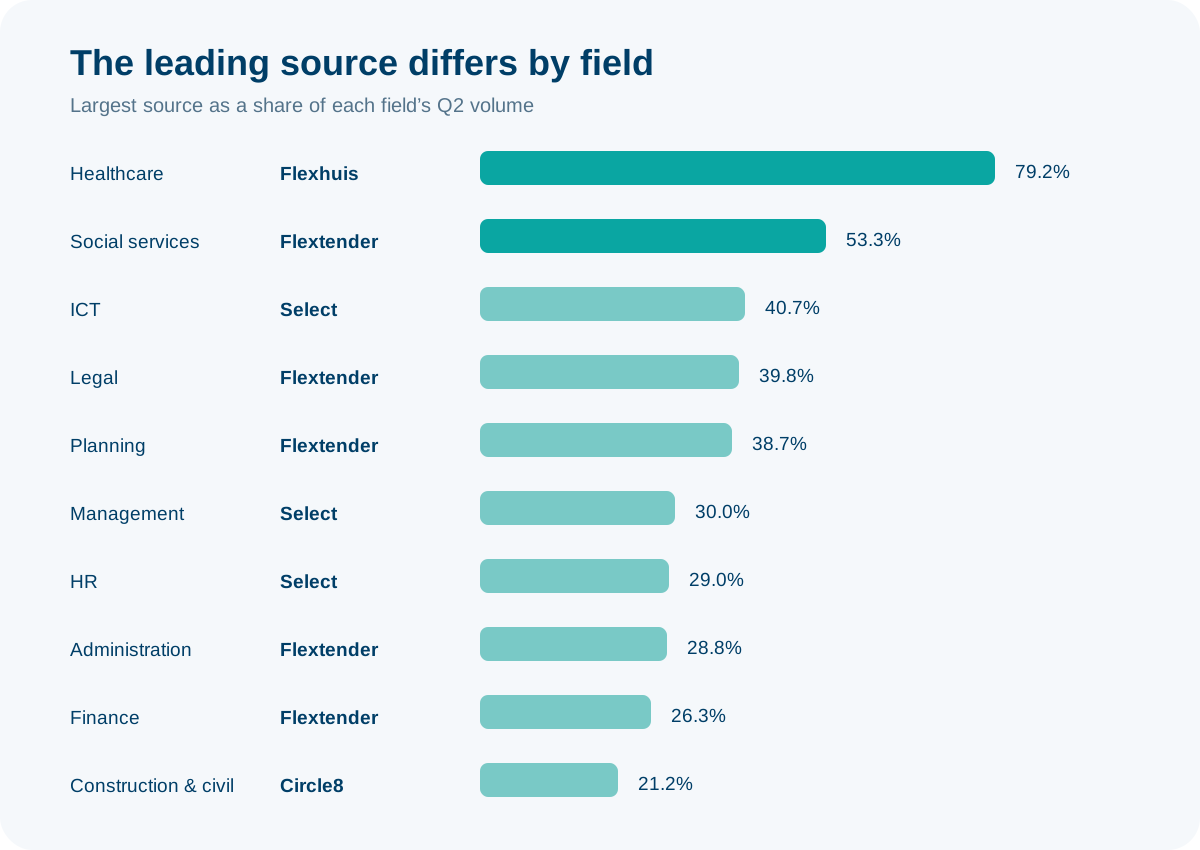
The distribution of sources highlights opportunities for staffing agencies to expand their market coverage. The percentages below show the largest source's share within each field in Q2.
Several patterns stand out:
- ICT: Select supplied 41 percent of requests and Circle8 supplied 29 percent. Together with Yacht and Flextender, the top four accounted for 81 percent.
- Social services: 53 percent came through Flextender. Flex West-Brabant and Werken in Friesland were the next largest individual sources.
- Spatial planning and public administration: Flextender represented 39 percent. The rest was spread across sources including Circle8, Select, Flex West-Brabant and Magnit.
- Construction and civil engineering: the market was more evenly distributed. Circle8 had 21 percent, followed by Magnit with 17 percent, Select with 15 percent and Flextender with 13 percent.
- Healthcare: Flexhuis was by far the largest source in this dataset at 79 percent. Flextender and Staffing MS followed at a distance.
- Finance: Flextender, Select and Magnit were close together at 26, 22 and 20 percent respectively. Broad coverage therefore requires access to multiple environments.
Across all fields, Select, Flextender and Circle8 accounted for 62 percent of Q2 volume. The ten largest sources represented almost 84 percent. This helps set priorities. For a specialist agency, the distribution within its own field is more useful than a generic top ten.
Zuid-Holland and Utrecht together formed the centre of activity
Zuid-Holland recorded 2,321 requests in Q2 and Utrecht 1,894. Gelderland followed with 1,228, Noord-Holland with 1,034 and Noord-Brabant with 790. Together, these five provinces represented almost 80 percent of requests with a known province.
Trends differed between provinces. Groningen grew by 18.1 percent to 574 requests. Overijssel, Flevoland and Limburg increased slightly. Volume fell by 8.9 percent in Zuid-Holland and 9.9 percent in Noord-Holland. Zeeland declined by 39.1 percent to 81 requests, although its absolute volume is small.
The regional distribution reflects the clients and sources in the dataset. Large national and public organisations are often associated with a location in the Randstad. This also applies to partly hybrid assignments. For regional sales planning, the combination of province and source is therefore more informative than province alone.
Six in ten requests called for a senior profile
Requested seniority was classified for all Q2 requests. Senior profiles made up 60.7 percent of volume. Mid-level profiles followed with 29.8 percent. Junior and internship profiles together did not exceed 3.2 percent.
| Experience level | Requests | Share |
|---|---|---|
| Senior | 5,682 | 60.7% |
| Mid-level | 2,785 | 29.8% |
| Manager | 571 | 6.1% |
| Junior | 292 | 3.1% |
| Executive | 18 | 0.2% |
| Intern | 6 | 0.1% |
The monitored DAS and VMS market primarily demands experienced professionals. Agencies with mainly junior profiles therefore face a much smaller directly accessible market than the total number of requests suggests.
Freelancers were explicitly permitted in 10.6 percent of requests
In 987 Q2 requests, freelancers or self-employed professionals were explicitly permitted. They were excluded in 5,680 requests. For 2,687 requests, the publication did not provide a clear answer.
| Freelancer eligibility | Requests | Share |
|---|---|---|
| Permitted | 987 | 10.6% |
| Not permitted | 5,680 | 60.7% |
| Unknown | 2,687 | 28.7% |
The 987 requests therefore form a verifiable minimum, not an estimate of total freelance volume. A staffing agency with employed professionals has direct access to a larger share of the market than an agency working exclusively with self-employed professionals.
More than half of requests closed within seven days
For 9,143 requests, the time between registration and closing date could be calculated. The median was 6.8 days. For 25 percent, no more than 5 days remained; for 75 percent, no more than 10 days remained.
Differences between fields were substantial. ICT had a median response window of 5.8 days; spatial planning and public administration had 9.8 days, and healthcare had 13.5 days. The source mix contributes to this. Select and Magnit had median windows of 5.0 and 4.0 days respectively, compared with 9.7 days for Flextender and 10.8 days for Mercell.
For staffing agencies, this translates into a practical choice. In ICT, broad source coverage needs fast delivery of new requests to the right recruiter or consultant. Segments with longer windows offer more room for substantive selection. Early detection still helps with candidate coordination and collecting the required documents.
What this Market Monitor means for your source strategy
The data points to three different strategies:
- Concentrate on a dominant channel. For agencies focused on healthcare or social services, Flexhuis and Flextender respectively supply a large share of visible volume. Access and a well-organised process around that environment take priority.
- Diversify in fragmented fields. No single source dominates construction and civil engineering or finance. Coverage requires a combination of supplier environments, platforms and direct hiring channels.
- Connect monitoring to response times. In ICT, 72 percent of requests closed within seven days of registration. Adding a source without fast internal follow-up increases visibility. It does not automatically improve the chance of proposing a suitable candidate in time.
Method and scope
This edition is based on 19,112 requests recorded by NIXZ between 1 January and 30 June 2026 through DASFeed and JobFeed. Of these, 9,758 fell in Q1 and 9,354 in Q2. DASFeed provides access to individual dynamic purchasing systems and hiring marketplaces, including those of government bodies, educational institutions, water authorities and other public organisations. JobFeed contains requests from connected VMS and supplier environments. Requests under framework agreements and assignments from private freelance platforms are excluded. The current NIXZ source overview contains the complete list of sources and underlying registrations.
BrokerFeed was deliberately excluded. Brokers may republish requests already available through a DAS, VMS or another supplier environment. Excluding this feed limits the influence of such republications on the statistics.
A province was known for 97.5 percent of Q2 requests. For 97.7 percent, the time until the formal closing date could be calculated. Fields are based on the NIXZ classification. The figures describe publication activity within DASFeed and JobFeed sources. They do not describe contract awards, placements or realised revenue.